Shipping disruptions in the Red Sea could temporarily impact goods prices but not at the same magnitude as during the pandemic. Tight financial conditions, slowing economic growth, and a disinflationary trend all support the Federal Reserve’s (Fed) pivot away from tightening monetary policy to easing in the new year. Despite these longer term trends, rates possibly got ahead of themselves in recent weeks, exhibiting higher volatility.
Supply Chain Shocks Not The Same Magnitude As Pandemic Ones
The global economy experienced multiple shocks in recent times from the Russian attacks on Ukraine, atrocities in the Middle East, the seating of an unconventional president in Argentina, and most recently, a crisis in the Red Sea. Yet, markets and the economy remain surprisingly resilient. Could the recent challenges in inter-continental shipping contribute to a resurgence of inflation and hamper the Fed’s plans this year?
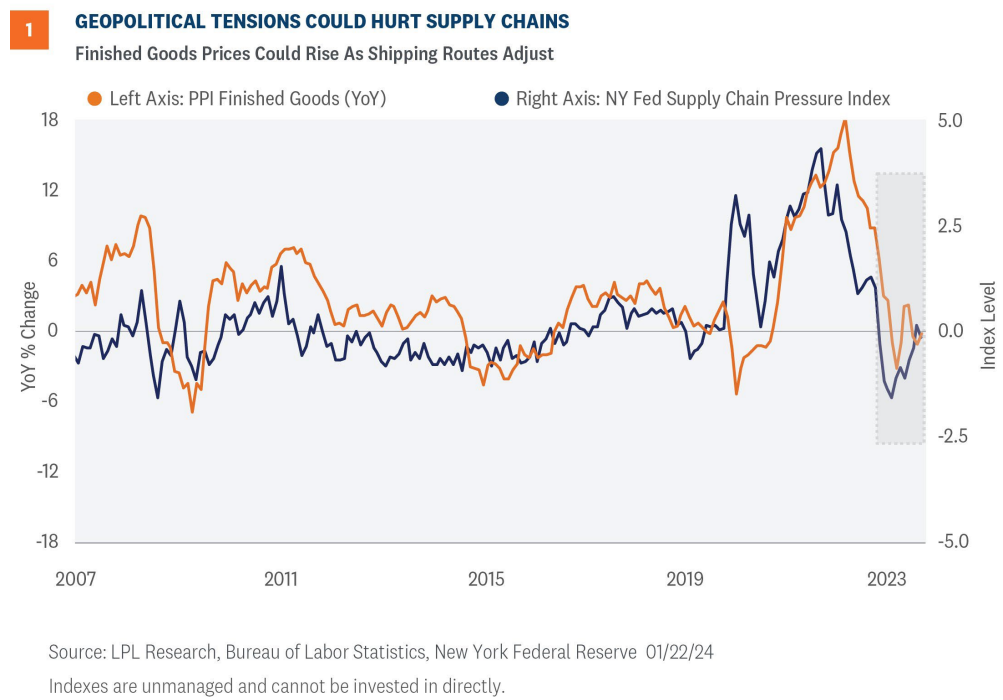
During the depth of the pandemic, shipping lanes backed up due to understaffed ports and insufficient supply of intermodal containers. Additionally, activity at production plants was hampered from governmental restraints and inconsistent labor supply. Investors often overlook the length of time for the backlogs to clear — ports didn’t return to more normal levels until the middle of 2022.1 The lack of supply during the early stages of the pandemic was a significant driver for goods inflation.
The current situation is fundamentally different, but not without its risks. Supply chains had a roller coaster experience in the last 18 months as illustrated in Figure 1. The New York Fed Supply Chain Pressure Gauge tightened in the previous month as companies look for alternative routes amid dangerous conditions. Shippers expect the situation to worsen in the coming days.2 Before addressing the issue at hand, we first describe the macro landscape for the bond market.
1 https://www.interos.ai/blog-whats-causing-port-backups-and-shipping-delays-interos/
2 https://www.supplychaindive.com/news/ocean-freight-rates-continue-climb-red-sea-crisis-Suez-Canal/704386/
Markets Are Skating To Where The Puck Is Headed, But Are They Offsides?
Hockey great Wayne Gretzky had an almost innate ability to put himself in a position to succeed. His secret was that he would skate to where the puck was going, not where it had been — meaning he would anticipate how a play would develop and get into position before it took place. Markets are seemingly following that same playbook as it comes to expected Fed rate cuts in 2024. Due to the strong disinflationary impulse experienced over the past few months, markets are anticipating an aggressive rate cutting plan that, we think, has gone too far, too fast.
Until the sell-off in the rates market last week, markets were anticipating over six 0.25% rate cuts in 2024 (over five cuts are still expected). And while we agree that the next move by the Fed will likely be a rate cut, we think the Fed will be more patient than markets are currently expecting (our view is that the Fed will likely cut its policy rate four times in 2024). Last month, Fed officials noted that three rate cuts were likely in 2024. So, we think the amount of rate cuts priced into markets is unlikely going to come to fruition, and that could put slight upward pressure on Treasury yields at some point this year.
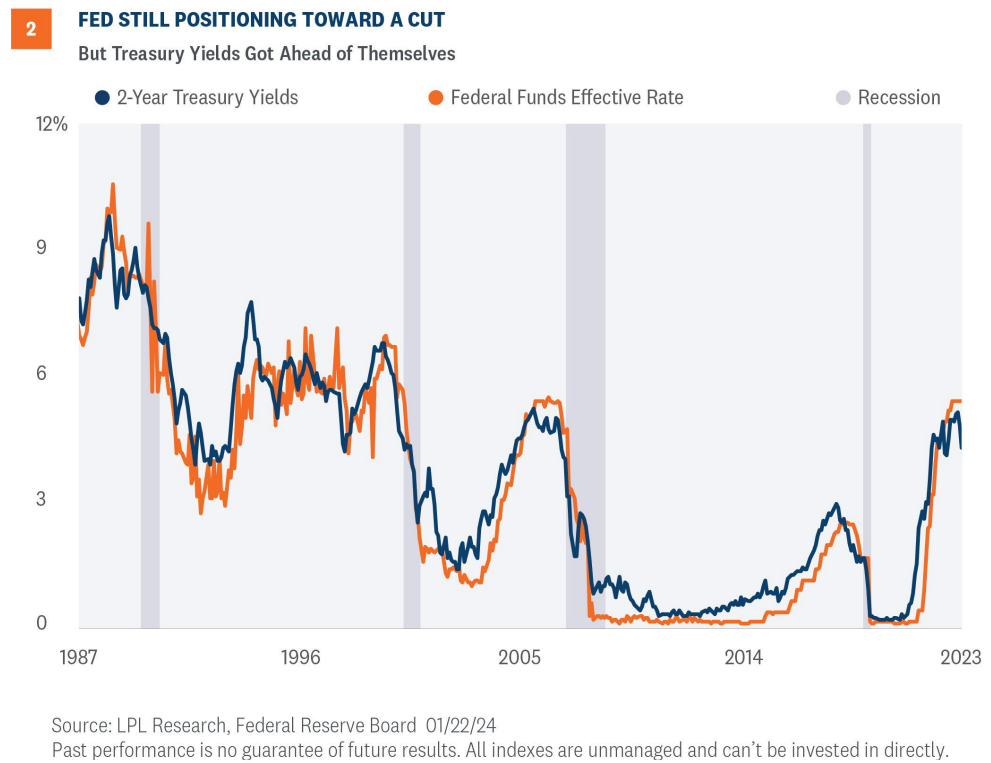
As illustrated in Figure 2, the 2-year Treasury yield tends to track the expected path of the fed funds rate fairly closely. So, with the aggressive rate cuts anticipated in 2024, the policy-sensitive 2-year yield has fallen by over 1% since rate cuts started to get priced in. So, if we are right about the number of rate cuts for 2024, we’re likely going to see the 2-year yield higher — not by a lot per se, but higher than current levels. And given the interconnectedness of the U.S. Treasury yield curve, that means Treasury yields in general are unlikely to fall much from current levels. Our view, as outlined in our Outlook 2024: A Turning Point, is predicated on four rate cuts this year, and thus we think the 10-year Treasury yield will end the year between 3.75% and 4.25%. More (fewer) rate cuts could mean lower (higher) yields than what we’re expecting.
The disinflationary impulses seen over the past few months have clearly shifted the narrative from additional rate hikes to eventual rate cuts. That shift has allowed Treasury yields to fall from decade high levels. But, as markets are wont to do at times, we think the recent rally in rates has gotten ahead of itself and is ready for a breather.
Inflation On Two Different Glide Paths
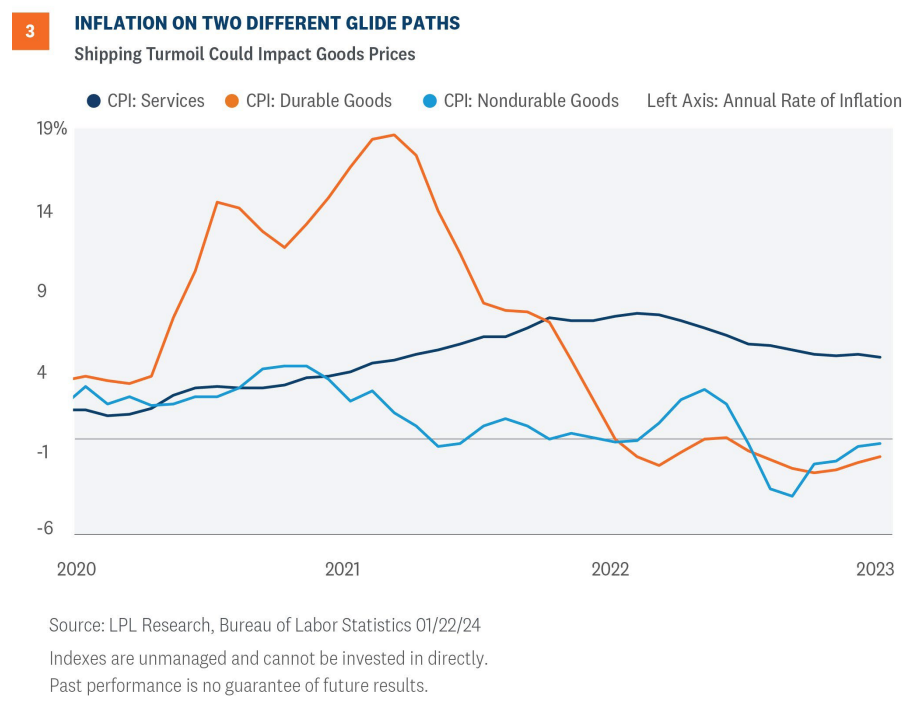
So, let’s go back to the specific issue at hand. Hampered supply chains indeed impact goods producer prices, and we should expect firms to pass along those higher prices to the end consumer. Other than the brief period in March and April 2020, when prices temporarily fell as businesses were shuttered and consumers had not started their spending splurge, we often see tighter supply chains impact inflation.
So why is the current problem different? Right after the start of the pandemic, firms struggled to set market-clearing prices, and many initially thought inflation was transitory, a forecast that ended embarrassingly. However, since the beginning of 2023, the annual rate of inflation for durable goods was negative (Figure 3). So, although supply disruptions will likely bring upward pressure on goods prices, we don’t think the temporary shock will change the Fed’s pivot from hiking rates to cutting rates. And if the data supports it, we could see the first cut in March.
Summary
LPL’s Strategic and Tactical Asset Allocation Committee (STAAC) continues to recommend a slight tilt toward domestic over international equities, with a modest overweight to fixed income funded from cash and neutral equities position. Even with the S&P 500 at a new record high, individual investor sentiment survey data has reflected some reining in of optimism amid heightened geopolitical risks, while historically overbought market conditions have reset. Bottom line, the risk-reward trade-off between stocks and bonds still looks relatively balanced to us, even at slightly higher yields and with the potential for a slowdown in the economy. We continue to favor core bonds over cash, given short-term fixed income investments offer attractive return profiles but also carry reinvestment risk.
IMPORTANT DISCLOSURES
This material is for general information only and is not intended to provide specific advice or recommendations for any individual. There is no assurance that the views or strategies discussed are suitable for all investors or will yield positive outcomes. Investing involves risks including possible loss of principal. Any economic forecasts set forth may not develop as predicted and are subject to change.
References to markets, asset classes, and sectors are generally regarding the corresponding market index. Indexes are unmanaged statistical composites and cannot be invested into directly. Index performance is not indicative of the performance of any investment and do not reflect fees, expenses, or sales charges. All performance referenced is historical and is no guarantee of future results.
Any company names noted herein are for educational purposes only and not an indication of trading intent or a solicitation of their products or services. LPL Financial doesn’t provide research on individual equities.
All information is believed to be from reliable sources; however, LPL Financial makes no representation as to its completeness or accuracy.
US Treasuries may be considered “safe haven” investments but do carry some degree of risk including interest rate, credit, and market risk. Bonds are subject to market and interest rate risk if sold prior to maturity. Bond values will decline as interest rates rise and bonds are subject to availability and change in price.
The Standard & Poor’s 500 Index (S&P500) is a capitalization-weighted index of 500 stocks designed to measure performance of the broad domestic economy through changes in the aggregate market value of 500 stocks representing all major industries.
The PE ratio (price-to-earnings ratio) is a measure of the price paid for a share relative to the annual net income or profit earned by the firm per share. It is a financial ratio used for valuation: a higher PE ratio means that investors are paying more for each unit of net income, so the stock is more expensive compared to one with lower PE ratio.
Earnings per share (EPS) is the portion of a company’s profit allocated to each outstanding share of common stock. EPS serves as an indicator of a company’s profitability. Earnings per share is generally considered to be the single most important variable in determining a share’s price. It is also a major component used to calculate the price-to-earnings valuation ratio.
All index data from FactSet.
Value investments can perform differently from the market as a whole. They can remain undervalued by the market for long periods of time.
The prices of small cap stocks are generally more volatile than large cap stocks.
International investing involves special risks such as currency fluctuation and political instability and may not be suitable for all investors. These risks are often heightened for investments in emerging markets.
LPL Financial does not provide investment banking services and does not engage in initial public offerings or merger and acquisition activities.
This research material has been prepared by LPL Financial LLC.
Securities and advisory services offered through LPL Financial (LPL), a registered investment advisor and broker-dealer (member FINRA/SIPC). Insurance products are offered through LPL or its licensed affiliates. To the extent you are receiving investment advice from a separately registered independent investment advisor that is not an LPL affiliate, please note LPL makes no representation with respect to such entity.
Not Insured by FDIC/NCUA or Any Other Government Agency | Not Bank/Credit Union Guaranteed | Not Bank/Credit Union Deposits or Obligations | May Lose Value
RES-000524-1223 | For Public Use | Tracking #530032 (Exp. 01/2025)
For a list of descriptions of the indexes referenced in this publication, please visit our website at lplresearch.com/definitions.