The difference between strategic and tactical investment time horizons can be likened to the ebb and flow of tidal patterns in oceans. Strategic investing mirrors the steady rise and fall of the tides, focusing on long-term goals and expectations more stable akin to the predictable rhythm of oceans. On the other hand, investing in tactical time horizons resembles the dynamic nature of changing tides, responding to short-term market conditions like unpredictable surges and waves in the sea. Here we compare and contrast these two distinct processes and recap our recent strategic asset allocation change.
DIFFERENT INVESTMENT TIME HORIZONS REQUIRE DIFFERENT APPROACHES
Just as the tides follow a predetermined cycle, strategic asset allocations adhere more closely to a specific asset allocation objective over longer periods of time, aiming to maintain balance and alignment to investment views that may take three-to-five years to play out. Much like a cargo ship ignoring smaller waves while the captain looks out toward the horizon, a strategic investment time horizon is designed to disregard short term market gyrations and focus on longer term drivers of returns.
LPL Research typically updates its Strategic Asset Allocation (SAA) once per year, to align with updates to our long-term market views, or Capital Market Assumptions (CMA). These asset allocation decisions, which may take several years to play out, take more heed of valuations and fundamentals, among other factors, to guide us on the long-term direction of markets. Valuations have historically correlated well to long-term stock market performance, much more than market performance from year to year.
The accompanying chart illustrates the relationship between the price-to-earnings ratio (P/E) for the S&P 500 Index and subsequent 10-year annualized returns. The dot formation from the upper left of the scatterplot chart to the lower right tells us that higher P/Es often precede weaker long-term stock market returns, while lower P/Es tend to be followed by stronger long-term performance.
STOCK VALUATIONS HAVE BEEN GOOD PREDICTORS OF LONG-TERM RETURNS
Relationship Between S&P 500 Price-to-Earnings Ratio and Future 10-Year Performance Is Strong
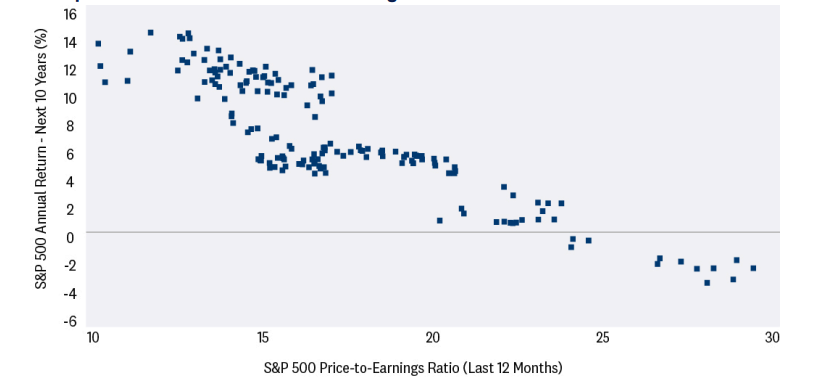
Source: LPL Research, FactSet 03/21/24 (Data from 1991 to Present)
Indexes are unmanaged and cannot be invested in directly.
Past performance is no guarantee of future results.
Despite looking out over a strategic horizon, our strategic outlook can change meaningfully from year to year in response to significant shifts in the drivers of long-term returns, a large structural change in the macroeconomic environment, or a change in asset class characteristics.
Investing over a tactical time horizon, on the other hand, resembles the dynamic nature of changing tides, responding to short-term market conditions like the unpredictable surges and waves in the sea. Like a sailor in a small boat who is heading north may adjust sails to veer east, west, or even south to pick up strong winds or avoid turbulent waters, our Tactical Asset Allocation (TAA) process is more nimble and actively managed, seeking to capitalize on timely market trends and fluctuations by making more frequent adjustments based on technical analysis and current market fundamentals.
Our tactical asset allocation decisions place less emphasis on valuations, which have been shown to have less predictive power over shorter time periods of a year or less (we wrote about that topic in a March 6, 2024, blog entitled “Valuations Aren’t Great Timing Tools”). We publish our Tactical Asset Allocation suggestions each month but can make changes to it as market opportunities present themselves, with the typical trade time horizon being at least three months but typically not much beyond one year.
Because of the distinct nature of the drivers of investment returns over these distinct investment time horizons there can be times when the strategic and tactical asset allocations don’t align with 3 Member FINRA/SIPC one another, even though they both have the same overall goal of exceeding their respective benchmarks. Much the same way as the captain of the cargo ship and the sailboat are heading for the same destination, they just take a different, and sometimes even opposite, route to get there. For example, valuations on international equities are attractive and that contributes to these remaining overweight in the SAA, but our tactical view, which puts less importance on current valuations, favors domestic equities due primarily to a tactical view on domestic economic growth.
STRATEGIC ASSET ALLOCATION UPDATE AND OUTLOOK
LPL Research’s recently released SAA and CMA aim to act as guiding stars to navigate this tricky market environment. Like skilled sailors combining analytical prowess with team-based wisdom, our approach blends quantitative modeling techniques with qualitative overlays of strategic insights from the LPL Research Strategic and Tactical Asset Allocation Committee (STAAC).
With the Federal Reserve’s (Fed) aggressive rate-hiking campaign of 2022-2023 behind us, we have entered 2024 with an equity risk premium (ERP) slightly below zero. The ERP compares the earnings derived from equities to the income (or yield) offered by high-quality fixed income.
A near-zero ERP is a far cry from the 5% level back in March of 2020 at the depths of the pandemic lockdown when the Fed took its target rate to zero and the 10-year yield plummeted to the lowest levels ever recorded near 0.5%. Equities offered tremendous strategic value back then, but less so now.
STOCK VALUATIONS ARE ELEVATED RELATIVE TO BONDS AFTER LATEST BACKUP IN RATES
Equity Risk Premium Offers Investors No Compensation for Taking on Equity Risk
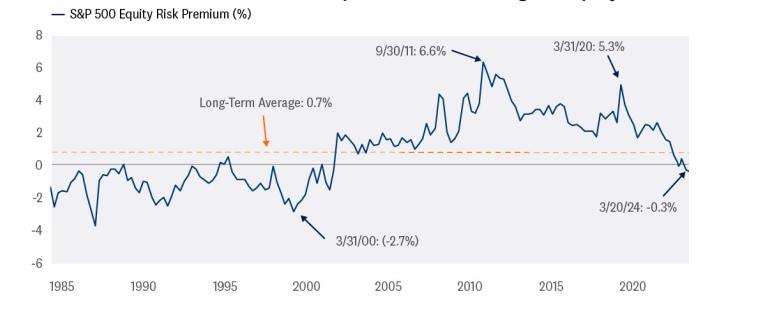
Source: LPL Research, Bloomberg, FactSet, Refinitiv 03/21/24
Indexes are unmanaged and cannot be invested in directly.
Past performance is no guarantee of future results.
S&P 500 equity risk premium is the S&P 500 earnings yield (earnings divided by price) minus the U.S. 10-year Treasury yield.
The STAAC continues to expect below average economic growth over the next few years due to structural factors (e.g., slow population growth, deficit spending, and increased cost of debt) but does anticipate inflation falling back to the Fed’s target rate. Coupled with full valuations currently (that’s probably being a bit generous), the equity markets do not currently offer much perceived value relative to fixed income over a long-term strategic time horizon.
Bottom line, akin to the winds that drive a ship forward in good times, we advise trimming equitiesback in the SAA to around neutral due to rich valuations relative to fixed income, removing the overweight allocation that had been in place for the past several years. This adjustment reflects a cautious stance in the face of evolving market conditions, emphasizing the importance of balancing and managing risk and reward over a three-to-five-year horizon. Fixed income, like a sturdy anchor that can prevent drifting off away in turbulent waters, sees increased core holdings recommended for diversification and income stability amidst competitive yields.
Alternative investments, acting as versatile sails that can be of use in changing winds, offer valuable diversification opportunities to navigate uncertainty. The SAA suggests a shift towards less market-sensitive strategies to enhance portfolio resilience in the face of potential volatility and economic surprises in the months and years ahead.
LPL RESEARCH GROWTH WITH INCOME (60/40) STRATEGIC ASSET ALLOCATION
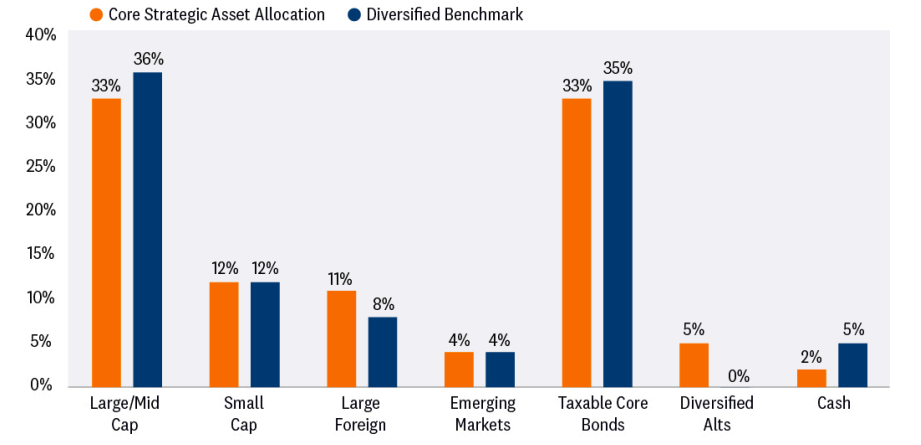
Source: LPL Research 03/21/24
CONCLUSION AND IMPLEMENTATION
While strategic investing provides stability and a long-term growth goal akin to the rhythmic tides, tactical investing offers flexibility and responsiveness to short-term opportunities and risks like the ever-changing sea. Both approaches have their merits, and an investment approach that combines both can be particularly compelling for investors to ride the steady waves of strategic investing while also navigating the choppy waters of tactical investing.
LPL Research’s 2024 SAA update steers investors towards a course of reduced risk through strategic adjustments across asset classes that attempts to optimize risk-adjusted returns within a long-term investment framework.
LPL clients can easily navigate the markets utilizing LPL Research’s Strategic Asset Allocation, Tactical Asset Allocation, or a combination of both by utilizing the multi-asset models that LPL Research manages within our managed account platforms (Model Wealth Portfolios (MWP), Strategic Asset Management (SAM/SWM), and Optimum Model Portfolios (OMP)). Please ask your LPL financial advisor for further details.
TACTICAL ASSET ALLOCATION INSIGHTS
LPL’s STAAC maintains its neutral equities stance in the TAA despite the strength of the latest stock market rally. The improved outlook for economic growth and earnings has kept the risk reward trade-off for stocks and bonds fairly well balanced, perhaps with a slight edge to bonds over stocks currently. Strong year-to-date stock market gains may have pulled forward some potential gains from Fed rate cuts and could leave limited upside over the balance of 2024.
Within equities, the STAAC continues to favor a tilt in the TAA toward domestic over international equities, with a preference for Japan among developed markets, and an underweight position in emerging markets (EM). The Committee recommends a very modest tilt toward the growth style after reducing its overweight position last week, in favor of eliminating the small cap underweight.
High-quality small cap stocks are attractively valued and have made technical progress. Finally, the STAAC continues to recommend a modest overweight to fixed income, funded from cash.
IMPORTANT DISCLOSURES
This material is for general information only and is not intended to provide specific advice or recommendations for any individual. There is no assurance that the views or strategies discussed are suitable for all investors or will yield positive outcomes. Investing involves risks including possible loss of principal. Any economic forecasts set forth may not develop as predicted and are subject to change.
References to markets, asset classes, and sectors are generally regarding the corresponding market index. Indexes are unmanaged statistical composites and cannot be invested into directly. Index performance is not indicative of the performance of any investment and do not reflect fees, expenses, or sales charges. All performance referenced is historical and is no guarantee of future results.
Any company names noted herein are for educational purposes only and not an indication of trading intent or a solicitation of their products or services. LPL Financial doesn’t provide research on individual equities.
All information is believed to be from reliable sources; however, LPL Financial makes no representation as to its completeness or accuracy.
US Treasuries may be considered “safe haven” investments but do carry some degree of risk including interest rate, credit, and market risk. Bonds are subject to market and interest rate risk if sold prior to maturity. Bond values will decline as interest rates rise and bonds are subject to availability and change in price.
The Standard & Poor’s 500 Index (S&P500) is a capitalization-weighted index of 500 stocks designed to measure performance of the broad domestic economy through changes in the aggregate market value of 500 stocks representing all major industries.
The PE ratio (price-to-earnings ratio) is a measure of the price paid for a share relative to the annual net income or profit earned by the firm per share. It is a financial ratio used for valuation: a higher PE ratio means that investors are paying more for each unit of net income, so the stock is more expensive compared to one with lower PE ratio.
Earnings per share (EPS) is the portion of a company’s profit allocated to each outstanding share of common stock. EPS serves as an indicator of a company’s profitability. Earnings per share is generally considered to be the single most important variable in determining a share’s price. It is also a major component used to calculate the price-to-earnings valuation ratio.
All index data from FactSet.
Value investments can perform differently from the market as a whole. They can remain undervalued by the market for long periods of time.
The prices of small cap stocks are generally more volatile than large cap stocks.
International investing involves special risks such as currency fluctuation and political instability and may not be suitable for all investors. These risks are often heightened for investments in emerging markets.
LPL Financial does not provide investment banking services and does not engage in initial public offerings or merger and acquisition activities.
This research material has been prepared by LPL Financial LLC.
Securities and advisory services offered through LPL Financial (LPL), a registered investment advisor and broker-dealer (member FINRA/SIPC). Insurance products are offered through LPL or its licensed affiliates. To the extent you are receiving investment advice from a separately registered independent investment advisor that is not an LPL affiliate, please note LPL makes no representation with respect to such entity.
Not Insured by FDIC/NCUA or Any Other Government Agency | Not Bank/Credit Union Deposits or Obligations | Not Bank/Credit Union Guaranteed | May Lose Value
RES-000823-0224 | For Public Use | Tracking #557620 (Exp. 03/2025)
For a list of descriptions of the indexes referenced in this publication, please visit our website at lplresearch.com/definitions.