Wall Street narratives rarely stay still, and recent weeks have underscored how quickly sentiment can change as perceived new information challenges the status quo. Widely discussed anxiety over a potential artificial intelligence (AI) bubble fueled by relentless capital spending on data center infrastructure has now transitioned into a broader set of worries about industry‑level disruption driven by rapidly advancing AI platforms. The software sector has been in the eye of this storm, with legacy enterprise vendors suddenly confronting fears of displacement. That concern has ignited a negative feedback loop that is fueling a ‘sell now ask questions later’ backdrop in the market.
Recently released models from OpenAI and Anthropic have amplified these concerns, extending bearish sentiment far beyond the software sector. Anthropic’s launch of new “Plugins” for its Claude platform, in particular, marks a shift from traditional generative AI responses toward agentic AI capable of carrying out specialized tasks across multiple corporate functions. Insurance carriers, alternative asset managers, legal‑services firms, real‑estate companies, and even transportation names have sold off sharply as investors reassess which business models may be most exposed to AI‑enabled reinvention. The core question now is whether these fears represent an overreaction, or whether accelerating AI capabilities are indeed signaling a fundamental shift in how work and productivity will be defined in the years ahead.
A New Chapter in the AI Story
When uncertainty rises, volatility usually follows as the market has a tendency of pricing in worst-case scenarios quickly. AI’s evolution has accelerated rapidly, shifting from novelty use cases to broad, productivity‑enhancing applications across industries. At this stage of the cycle, it appears apparent AI will continue permeating workflows and reshaping how work is executed, though likely without delivering the dramatic “yellow pages” event some investors now fear.
Undoubtedly, there will be disruption as with any transformative technology, but it probably won’t lead Another DeepSeek Momentto the extinction of the entire software industry, which is what the market is arguably beginning to price in across many companies in the space. Despite the re-rating in price and subsequent risk premium, fundamental deterioration has been relatively minimal. For example, the S&P North American Technology Software Index, home to 110 predominantly larger-cap software companies, is still forecasted to grow revenues this year by 17% and generate free cash flow margins by around 25% (free cash flows divided by revenue).
It is also important to recognize that many established enterprise software vendors remain deeply embedded within their customers’ technology stacks. Long‑term contracts, combined with costly and time‑consuming switching requirements, create meaningful friction against rapid displacement. Moreover, numerous software companies are incorporating AI directly into their existing product suites through partnerships with leading model developers. Salesforce (CRM), for example, has teamed with OpenAI and Alphabet (GOOG/L) to support its expanding Agentforce 360 platform, enabling customers to build AI agents natively within its CRM ecosystem.
Another DeepSeek Moment
The recent stretch of volatility across the technology sector has revived comparisons to the DeepSeek shock in January 2025. At that time, the China‑based AI firm upended market expectations by releasing its highly efficient R1 model, which delivered apparent performance comparable to leading U.S. systems at a fraction of the development cost, challenging the assumption that only massive capital expenditures could sustain AI progress. The announcement triggered a swift sell‑off across major AI beneficiaries as investors rapidly repriced assumptions around computing demand, competitive moats, and the durability of the broader AI investment cycle.
Although the reaction was sharp, the disruption proved short‑lived as markets stabilized and investors reconsidered the longer‑term implications of cheaper, more efficient AI development on sector leadership and capital spending. As discussed in a recent blog (Hyperscaler Capex Continues to Grow), capital expenditures have only accelerated since the DeepSeek news, with Google-parent Alphabet (GOOG/L), Microsoft (MSFT), Amazon (AMZN), Meta (META), and Oracle (ORCL) expected to spend over $600 billion on AI-related development in 2026.
While today’s AI‑driven market turbulence echoes aspects of the DeepSeek episode, recent price action also mirrors last year’s setup in the Nasdaq Composite, where overbought conditions and fatigue in AI‑related enthusiasm set the stage for heightened volatility. DeepSeek’s announcement at the time added fuel to that backdrop, contributing to steep drawdowns — such as NVIDIA’s more than 20% decline in only a few weeks. But unlike last year, new tariff announcements extended the volatility into April, even as the longer‑term secular AI trend remained firmly intact.
Nasdaq Momentum Mirrors its Pre‑DeepSeek Pattern From Early 2025
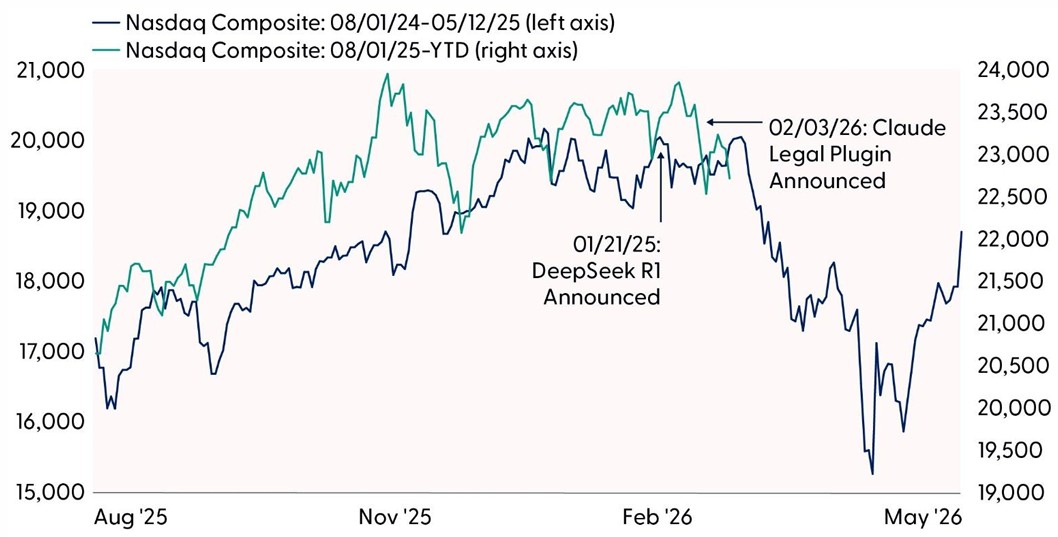
Source: LPL Research, Bloomberg, 02/12/26
Disclosures: Indexes are unmanaged and cannot be invested in directly. Past performance is no guarantee of future results.
Oversold, but is it Over?
Selling pressure has been severe across the software sector. The S&P North American Technology Software Index is down over 20% on the year and currently sits just over 30% below its September record high. Sentiment couldn’t get much worse, and positioning has been mostly a one-way street of short selling. According to Commodity Futures Trading Commission (CFTC) data, asset managers sold around $3.6 billion of Nasdaq futures during the week ending February 3, marking the largest week of short positioning in 11 months. Momentum indicators also reached historically oversold levels, with the Relative Strength Index (RSI) — a momentum oscillator used to measure the velocity of price action to determine trend strength — on the S&P North American Technology Index falling to its lowest level on record.
However, seller enthusiasm has started to fade and buyers have dipped their toes back into the beaten-up software space, especially the retail cohort who began buying the dip at a record pace earlier this month. This shift comes as the index approaches a major support level tracing back to the April lows. While a near‑term bounce is not surprising given the degree of oversold conditions, more technical confirmation is needed to validate a sustained recovery. A decisive move back above 1,915 would reclaim the early‑2024 highs and a major retracement level of the current sell‑off, strengthening the case that the latest rebound represents more than just a temporary relief rally.
Software Stocks Reach Historically Oversold Levels

Source: LPL Research, Bloomberg, 02/12/26
Disclosure: Indexes are unmanaged and cannot be invested in directly. Past performance is no guarantee of future results.
Valuation Support
The drastic re-rating of software stocks has brought valuations to historically low levels. Full-year 2026 earnings per share (EPS) estimates for the S&P North American Technology Index have been cut by over 10% over the last four weeks, marking the largest rate of change since the Federal Reserve (Fed) induced market sell-off in December 2018. Even with the downward revisions, software is still expected to grow earnings this year by 25%, according to Bloomberg data. Operating margins are also expected to expand this year to 39% from 23% in 2025. The enterprise value to expected next year’s sales ratio (which measures a company’s current total value to projected revenue for the next 12 months), has dropped to only 6.6, the lowest level since April. While low valuations can sometimes signal deeper structural issues, we believe the recent re-rating may be overly punitive given the broader fundamental strength still evident across the software landscape.
Software Valuations and Earnings Rerate Sharply Lower
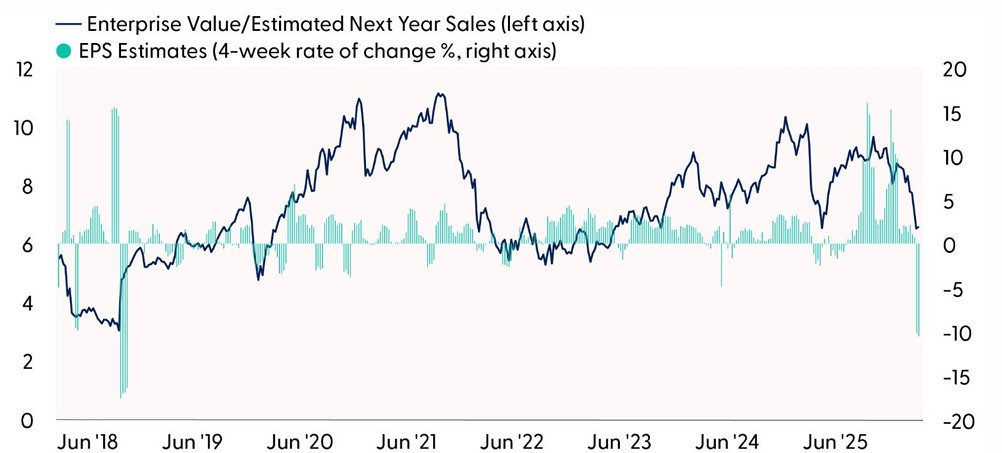
Source: LPL Research, Bloomberg, 02/12/26
Disclosures: Past performance is no guarantee of future results. Estimates may not materialize as predicted and are subject to change. The S&P North American Technology Sector Index includes U.S. securities classified as information technology companies, internet & direct marketing retail, interactive home entertainment, and interactive media & services sub-industries.
Implications for the Broader Market
Weakness across the technology sector (particularly within software) has weighed on the S&P 500 this year and contributed to the index’s difficulty breaking through the 7,000‑point barrier. A sustained move to new highs will likely require broader participation across tech and, at minimum, stabilization in software stocks. While the S&P 500’s longer‑term uptrend remains intact, recent pullbacks have come uncomfortably close to retesting the December lows, a key support level that also ties into the “December Lows” indicator introduced by Forbes columnist Lucien Hooper in the 1970s.
Hooper’s work showed that when the index breaks below its December low early in the year, full‑year performance tends to be weak — averaging just 0.6% returns, with only 55% of years finishing positive. In contrast, when the S&P 500 holds above that threshold in the first quarter, average annual returns climb to 19.5%, with 94% of years ending higher.
It’s important to remember, however, that seasonal indicators reflect historical tendencies rather than guarantees. They do not incorporate factors such as earnings trends, monetary or fiscal policy shifts, economic conditions, or geopolitical developments, all of which can significantly influence market outcomes.
S&P 500 Returns if December Lows Fail or Hold in Q1 (1950–2025)
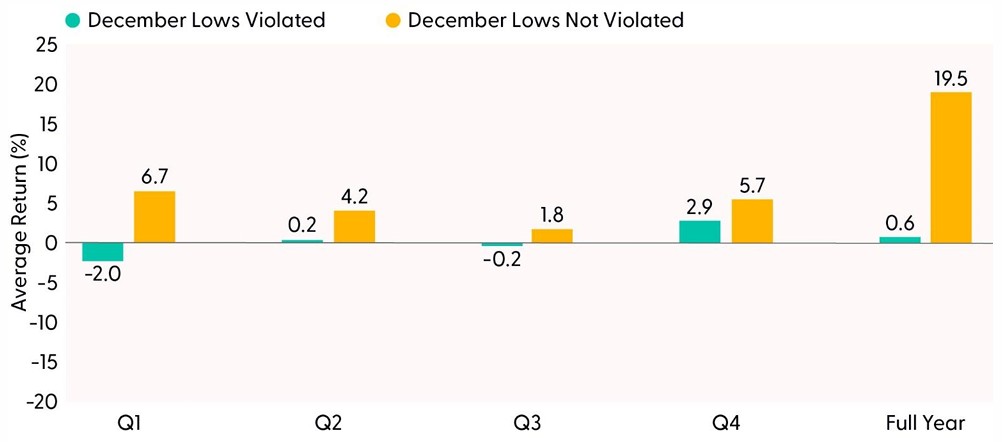
Source: LPL Research, Bloomberg, 02/12/26
Disclosures: Past performance is no guarantee of future results. All indexes are unmanaged and can’t be invested in directly. The modern design of the S&P 500 stock index was first launched in 1957. Performance back to 1950 incorporates the performance of the predecessor index, the S&P 90.
Conclusion
Overall, the recent volatility across software and AI‑exposed industries reflects a shift in the market narrative rather than a broad breakdown in fundamentals. While disruption from rapidly advancing AI is inevitable, the market appears to be pricing in worst‑case scenarios that may not fully account for the sector’s resilience and deep customer integration. Software companies continue to demonstrate strong revenue growth, improving margins, and competitive positioning, even as investor sentiment remains strained. Technical indicators also suggest the sector has reached historically oversold levels, creating the potential for stabilization or a rebound as selling pressure eases. Comparisons to past AI‑driven shocks, such as the DeepSeek episode, indicate that initial reactions can overshoot before price finds its footing. Ultimately, a sustained recovery will depend on renewed confidence in software’s adaptability and AI’s role as an enhancer, not a replacement, within enterprise workflows.
Asset Allocation Insights
LPL’s Strategic Tactical Asset Allocation Committee (STAAC) maintains its tactical neutral stance on equities. Investors may be well served by bracing for occasional bouts of volatility, such as those experienced last week. A lot of optimism is still reflected in stock valuations, but fundamentals remain broadly supportive. Technically, the broad market’s long-term uptrend remains intact, leaving the Committee biased to add equities exposure on potential further weakness.
STAAC’s regional preferences across the U.S., developed international, and emerging markets (EM) are aligned with benchmarks, though an improving fundamental and technical analysis picture in EM is noteworthy. The Committee still favors a slight growth style tilt, but value’s strong start to the year has our attention. In terms of domestic sectors, healthcare, industrials, and technology remain on our shopping list, while our conviction on communication services as an overweight has waned recently due to deteriorating technical analysis trends and the mostly negative reaction to fourth quarter earnings.
Within fixed income, the STAAC holds a neutral weight in core bonds, with a slight preference for mortgage-backed securities (MBS) over investment-grade corporates. The Committee believes the risk-reward for core bond sectors (U.S. Treasury, agency MBS, investment-grade corporates) is more attractive than plus sectors. The Committee does not believe adding duration (interest rate sensitivity) at current levels is attractive and remains neutral relative to benchmarks.
Important Disclosures
This material is for general information only and is not intended to provide specific advice or recommendations for any individual. There is no assurance that the views or strategies discussed are suitable for all investors or will yield positive outcomes. Investing involves risks including possible loss of principal. Any economic forecasts set forth may not develop as predicted and are subject to change.
References to markets, asset classes, and sectors are generally regarding the corresponding market index. Indexes are unmanaged statistical composites and cannot be invested into directly. Index performance is not indicative of the performance of any investment and do not reflect fees, expenses, or sales charges. All performance referenced is historical and is no guarantee of future results.
Any company names noted herein are for educational purposes only and not an indication of trading intent or a solicitation of their products or services. LPL Financial doesn’t provide research on individual equities.
All information is believed to be from reliable sources; however, LPL Financial makes no representation as to its completeness or accuracy.
All investing involves risk, including possible loss of principal.
US Treasuries may be considered “safe haven” investments but do carry some degree of risk including interest rate, credit, and market risk. Bonds are subject to market and interest rate risk if sold prior to maturity. Bond values will decline as interest rates rise and bonds are subject to availability and change in price.
The Standard & Poor’s 500 Index (S&P500) is a capitalization-weighted index of 500 stocks designed to measure performance of the broad domestic economy through changes in the aggregate market value of 500 stocks representing all major industries.
The PE ratio (price-to-earnings ratio) is a measure of the price paid for a share relative to the annual net income or profit earned by the firm per share. It is a financial ratio used for valuation: a higher PE ratio means that investors are paying more for each unit of net income, so the stock is more expensive compared to one with lower PE ratio.
Earnings per share (EPS) is the portion of a company’s profit allocated to each outstanding share of common stock. EPS serves as an indicator of a company’s profitability. Earnings per share is generally considered to be the single most important variable in determining a share’s price. It is also a major component used to calculate the price-to-earnings valuation ratio.
All index data from FactSet or Bloomberg.
This research material has been prepared by LPL Financial LLC.
Not Insured by FDIC/NCUA or Any Other Government Agency | Not Bank/Credit Union Guaranteed | Not Bank/Credit Union Deposits or Obligations | May Lose Value
For public use.
Member FINRA/SIPC.
RES-0006657-0126 Tracking #1064837 | #1065899 (Exp. 02/2027)